
📈 How to view organization-wide analytics
Why organization analytics matter
As an admin, you need visibility into how your team is using Content Camel and how your content is performing. Organization-wide analytics help you:
Measure content ROI - See which assets drive the most engagement
Monitor team adoption - Track who's actively using the platform
Identify top performers - Recognize team members who share effectively
Optimize your content library - Understand what works and what doesn't
Make data-driven decisions - Use real metrics to guide your content strategy
Accessing the analytics dashboard
Step 1: Navigate to Analytics
Click Analytics in the top navigation bar.
Alternatively, you can access it from your profile menu.
You'll see the organization-wide analytics dashboard with comprehensive metrics about your content and team.
Overview analytics
When you first land on the analytics page, you'll see the overview dashboard with high-level summary metrics.
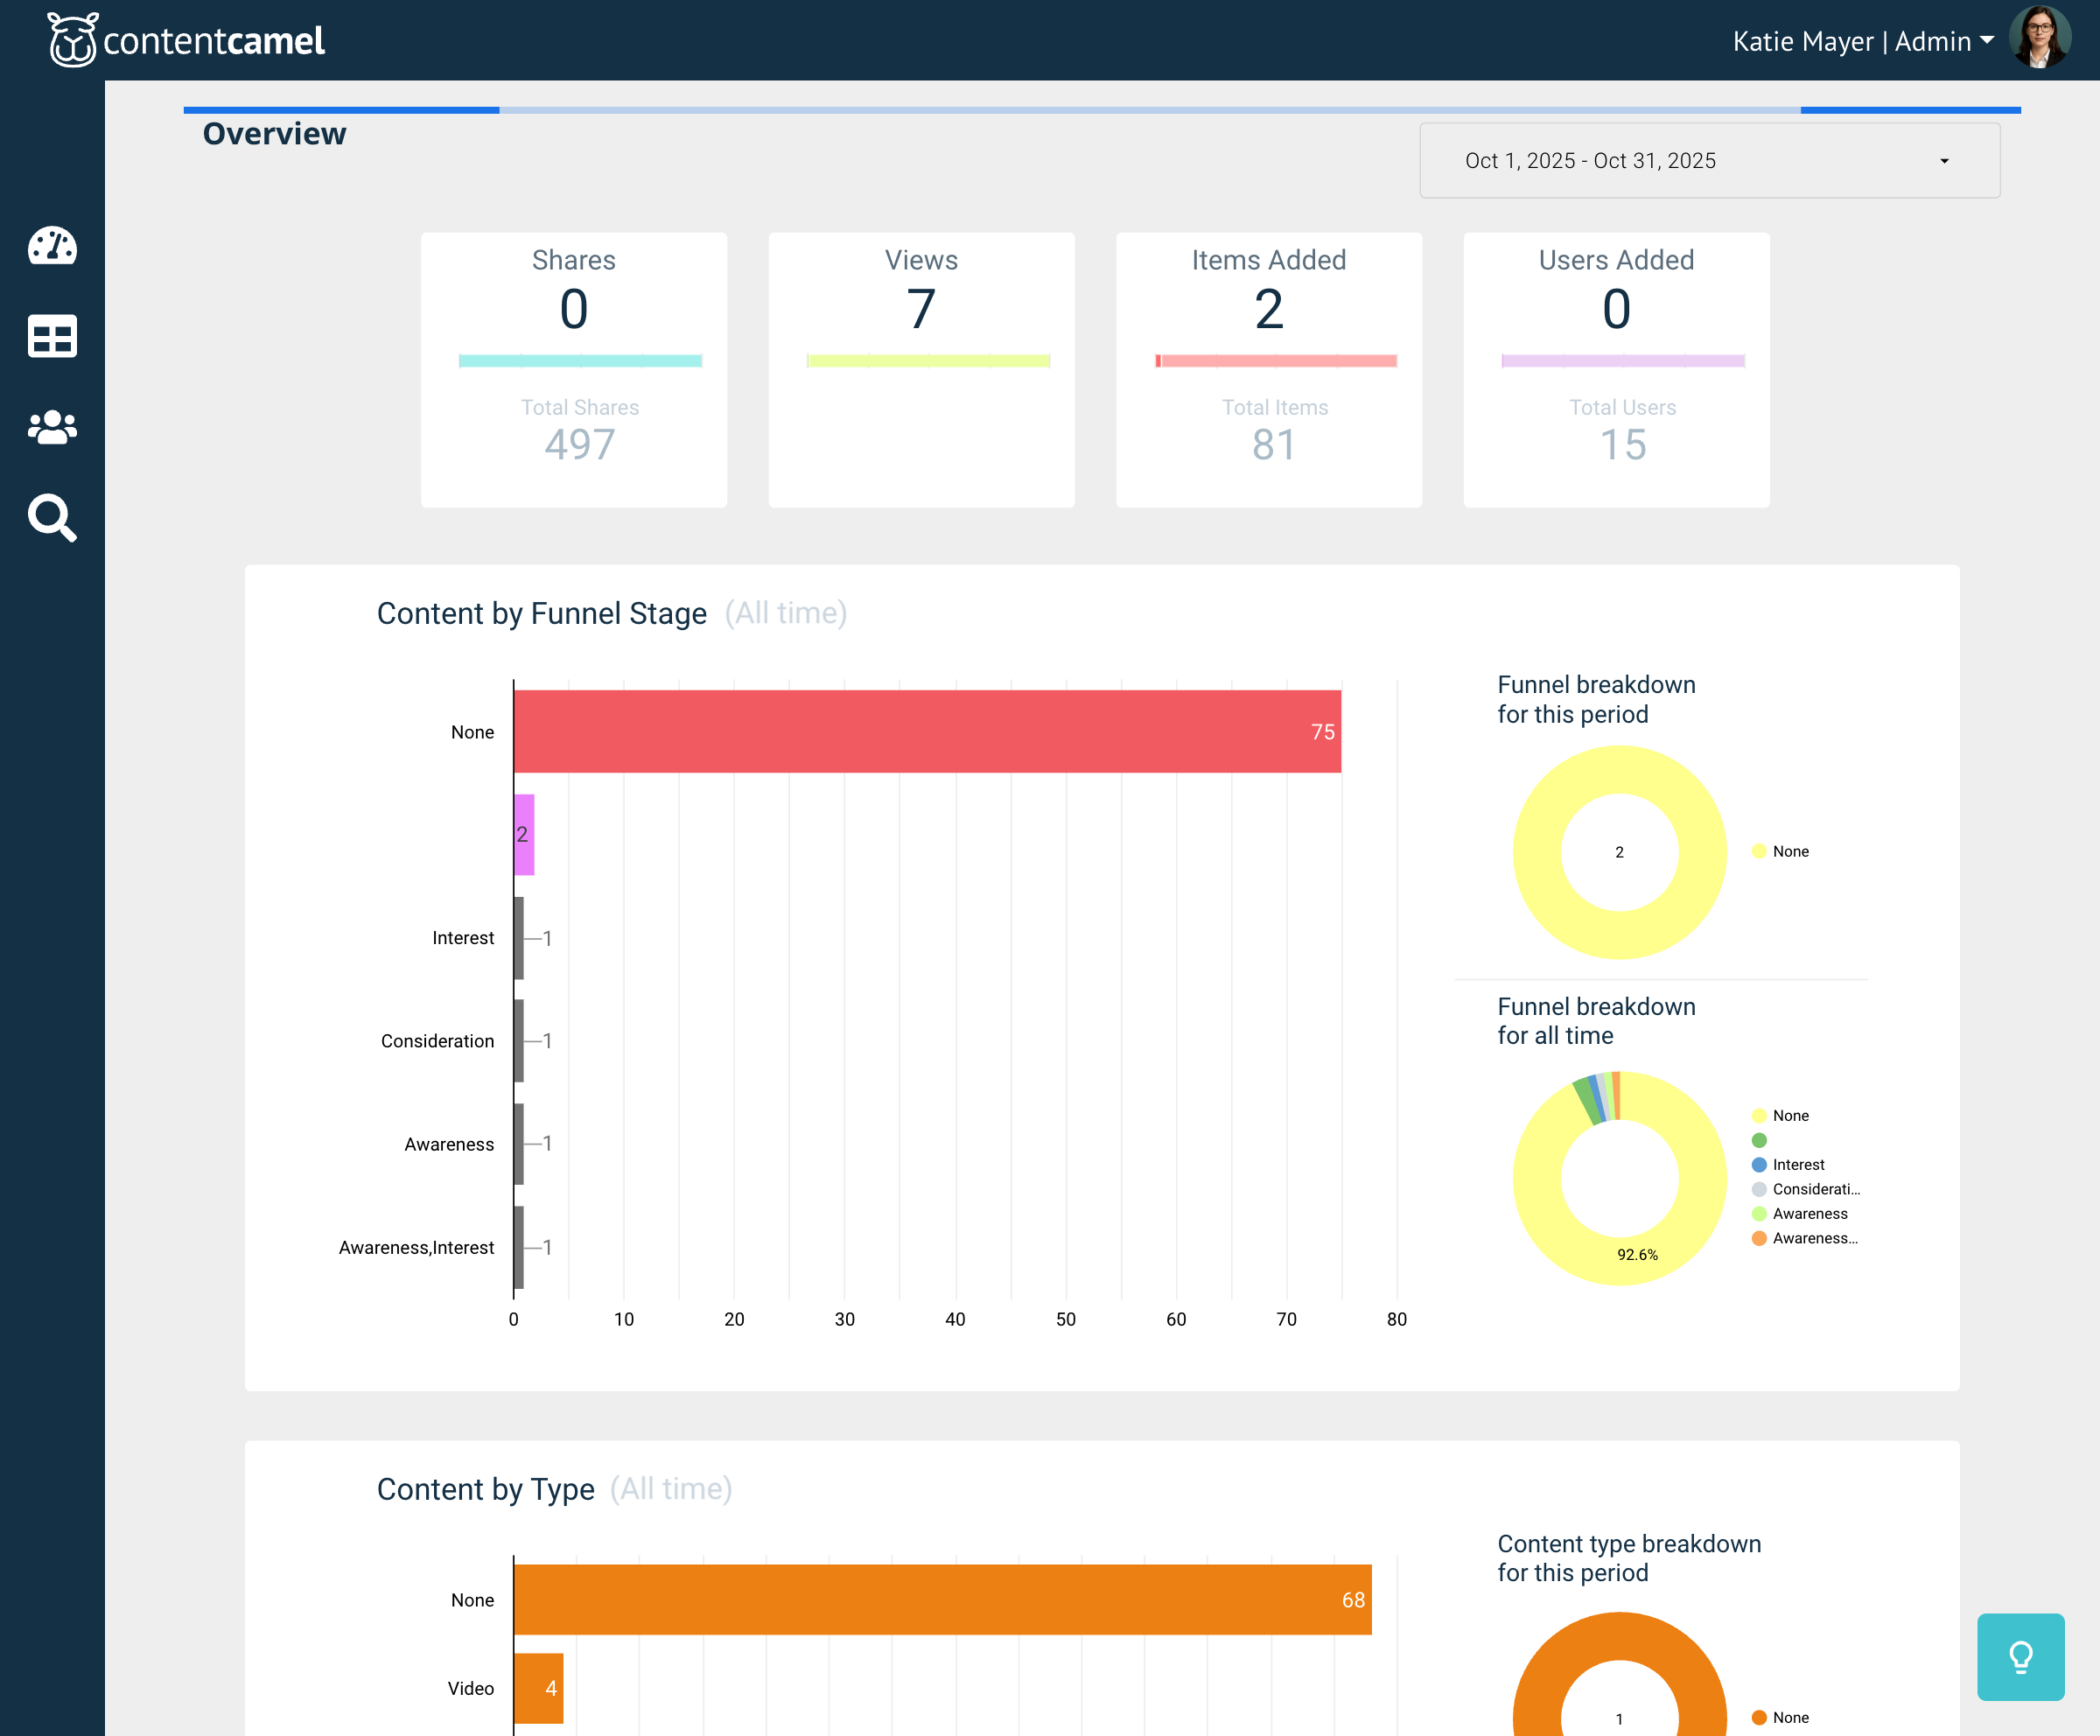
The overview shows:
Shares - Total number of times content has been shared
Views - Aggregate views across all content
Items Added - New content pieces uploaded
Users Added - New team members joined
You'll also see charts breaking down content by:
Funnel Stage - Where your content sits in the buyer journey
Content Type - Distribution of PDFs, videos, presentations, etc.
Asset engagement analytics
Want to see which specific pieces of content are performing best? Navigate to the Asset Engagement view.
Accessing asset engagement
Click the second navigation icon on the left sidebar to view asset-level analytics.
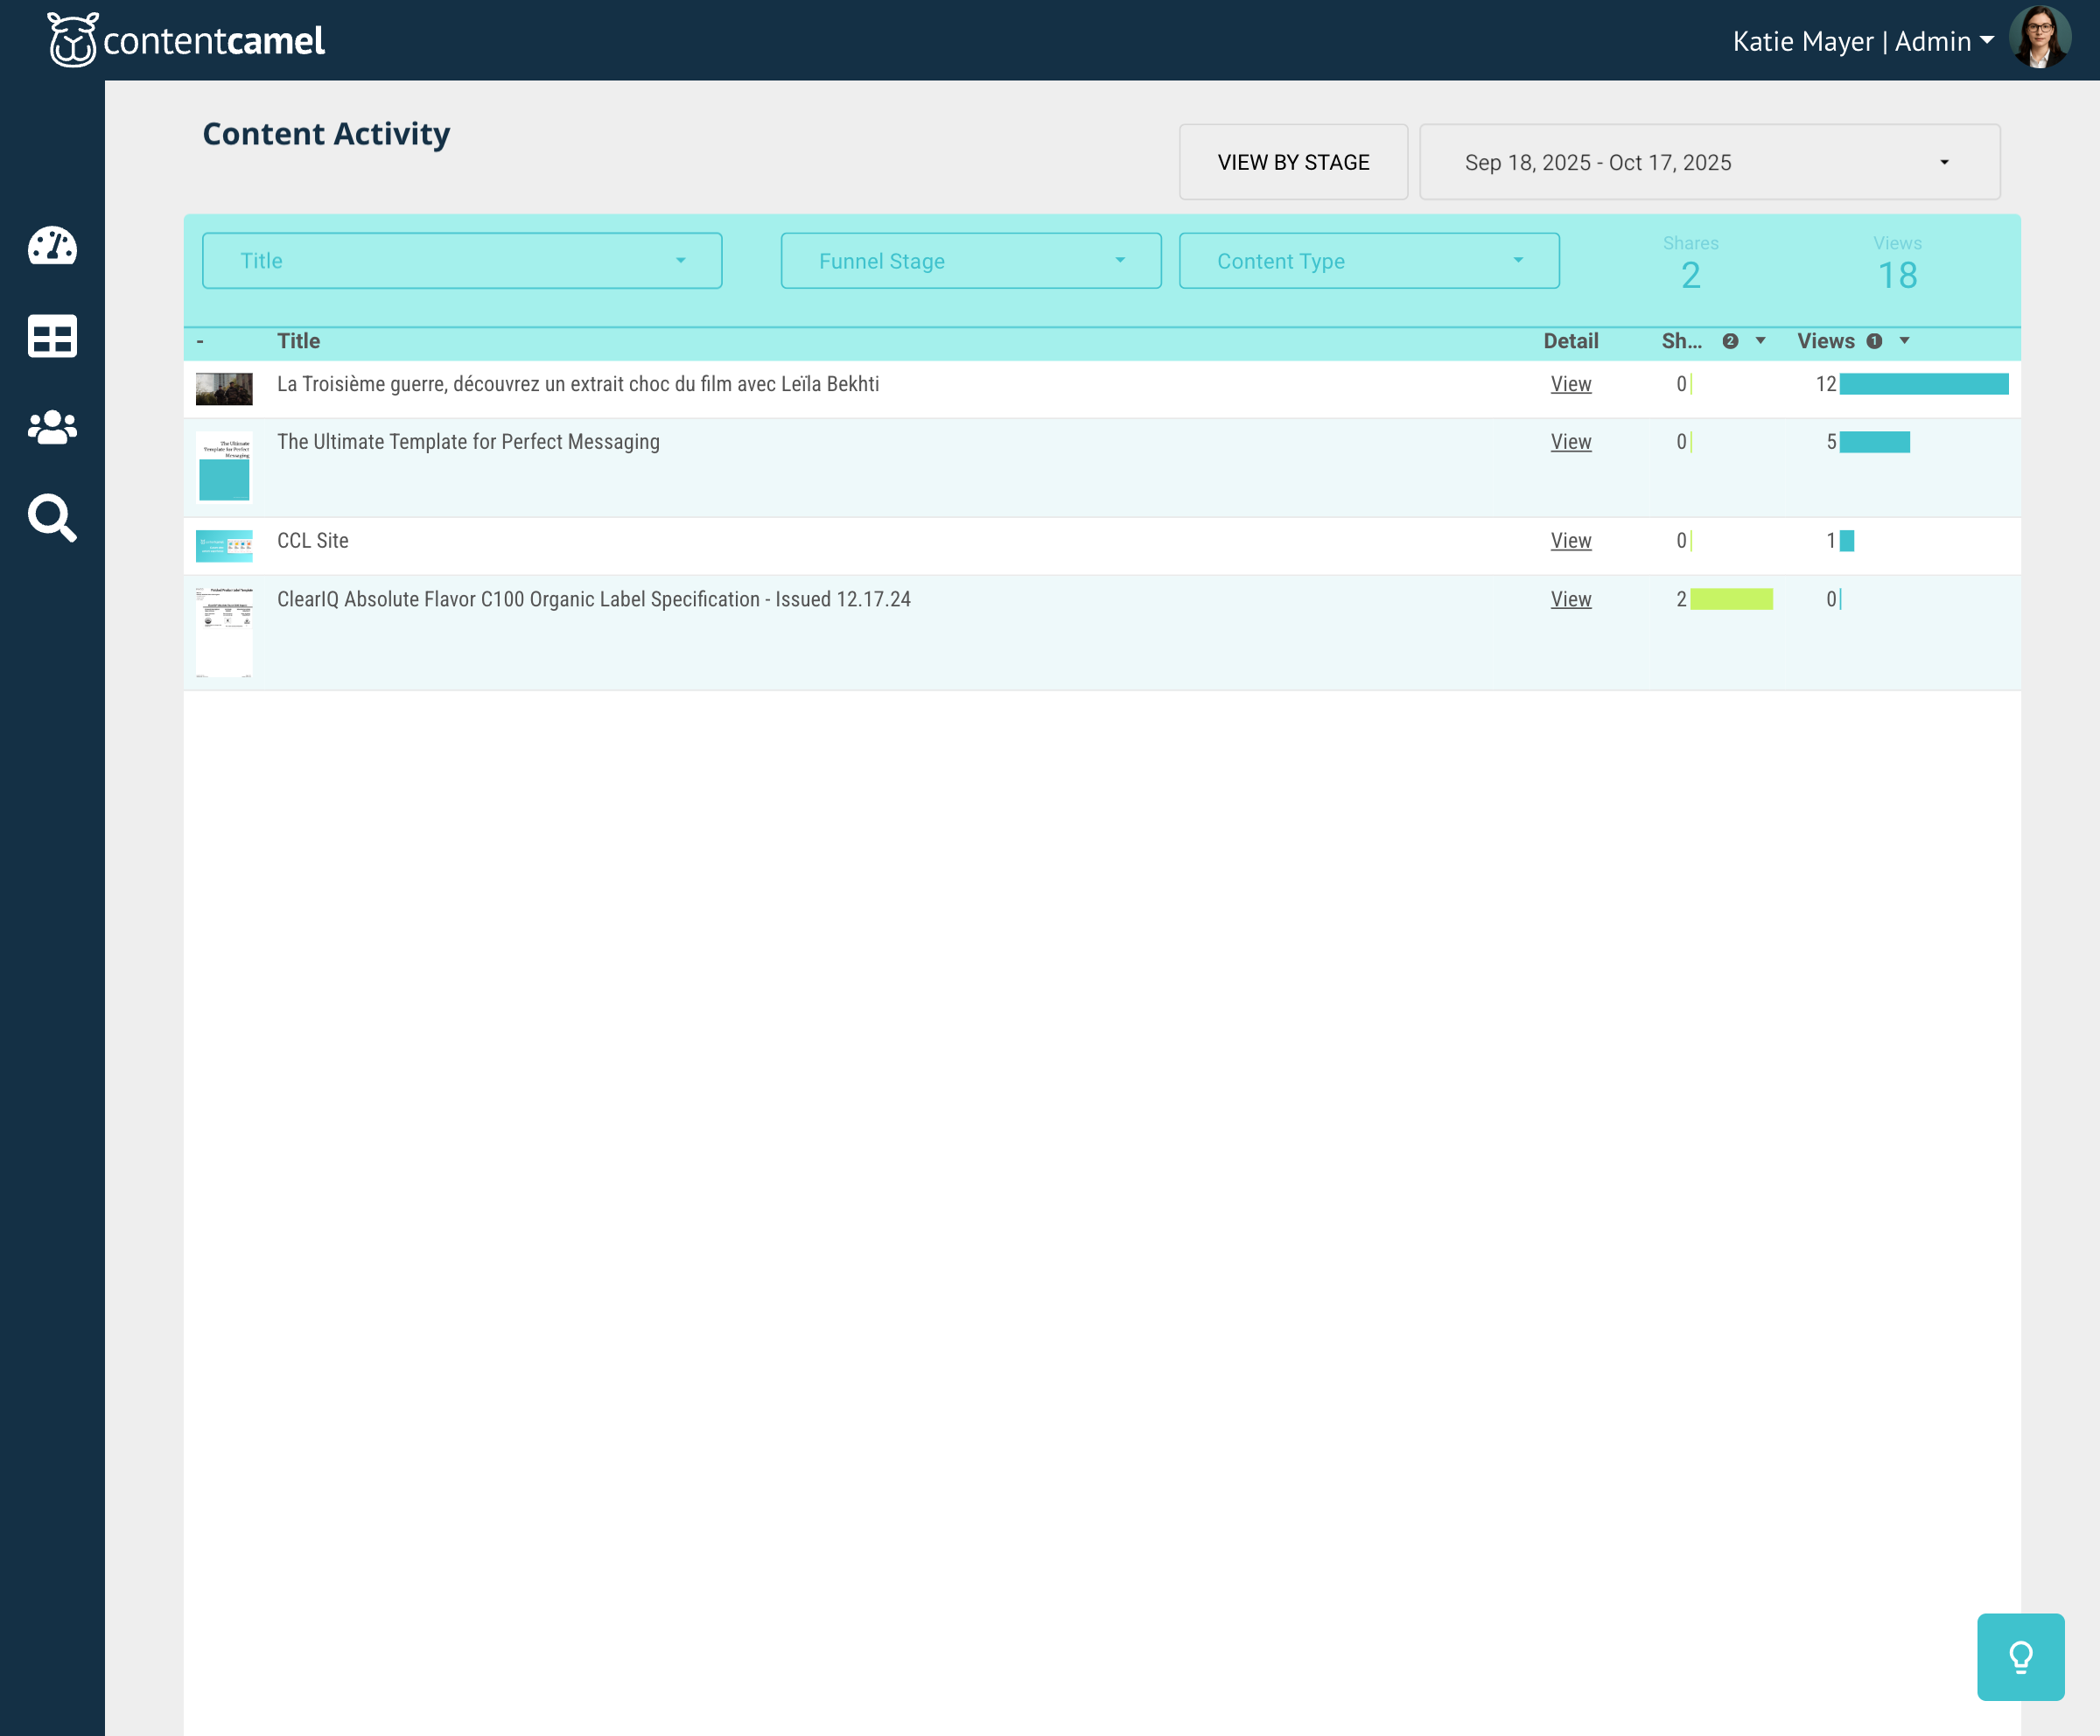
What you'll see
The Content Activity page shows detailed metrics for each asset:
Title - The name of the asset
Shares - How many times it's been shared
Views - How many times it's been viewed
Performance bars - Visual indicators of relative performance
Filtering content activity
You can filter the results by:
Title - Search for specific assets
Funnel Stage - See performance by buyer journey stage
Content Type - Filter by PDF, video, presentation, etc.
👉 TIP: Use the date range selector at the top right to adjust the reporting period and see trends over time.
Using this data
Asset engagement analytics help you:
Identify your top-performing content - Double down on what works
Find underperforming assets - Refresh or retire content that doesn't resonate
Make informed decisions - Know what to create more of
User share analytics
Understanding who on your team is sharing content and how effectively is crucial for coaching and recognition.
Accessing user engagement
Click the third navigation icon on the left sidebar to view user-level analytics.
What you'll see
The User Engagement page displays:
Name - Team member names with profile photos
Views - Total views generated by their shares
Shares - Number of times they've shared content
Performance visualization - Color-coded bars showing relative activity
Viewing detailed user activity
Click the VIEW DETAIL button to see even more granular data about:
Who team members are sharing with
Which content they share most often
Engagement rates on their shares
Timeline of their sharing activity
Using this data
User share analytics help you:
Recognize top performers - Celebrate team members who share effectively
Identify coaching opportunities - Help less active users get up to speed
Understand adoption - Track how well your team is using Content Camel
Share best practices - Learn from your most successful users
Search analytics
Understanding what your team searches for helps you organize content better and identify gaps in your library.
Accessing search analytics
Click the fourth navigation icon on the left sidebar to view search data.
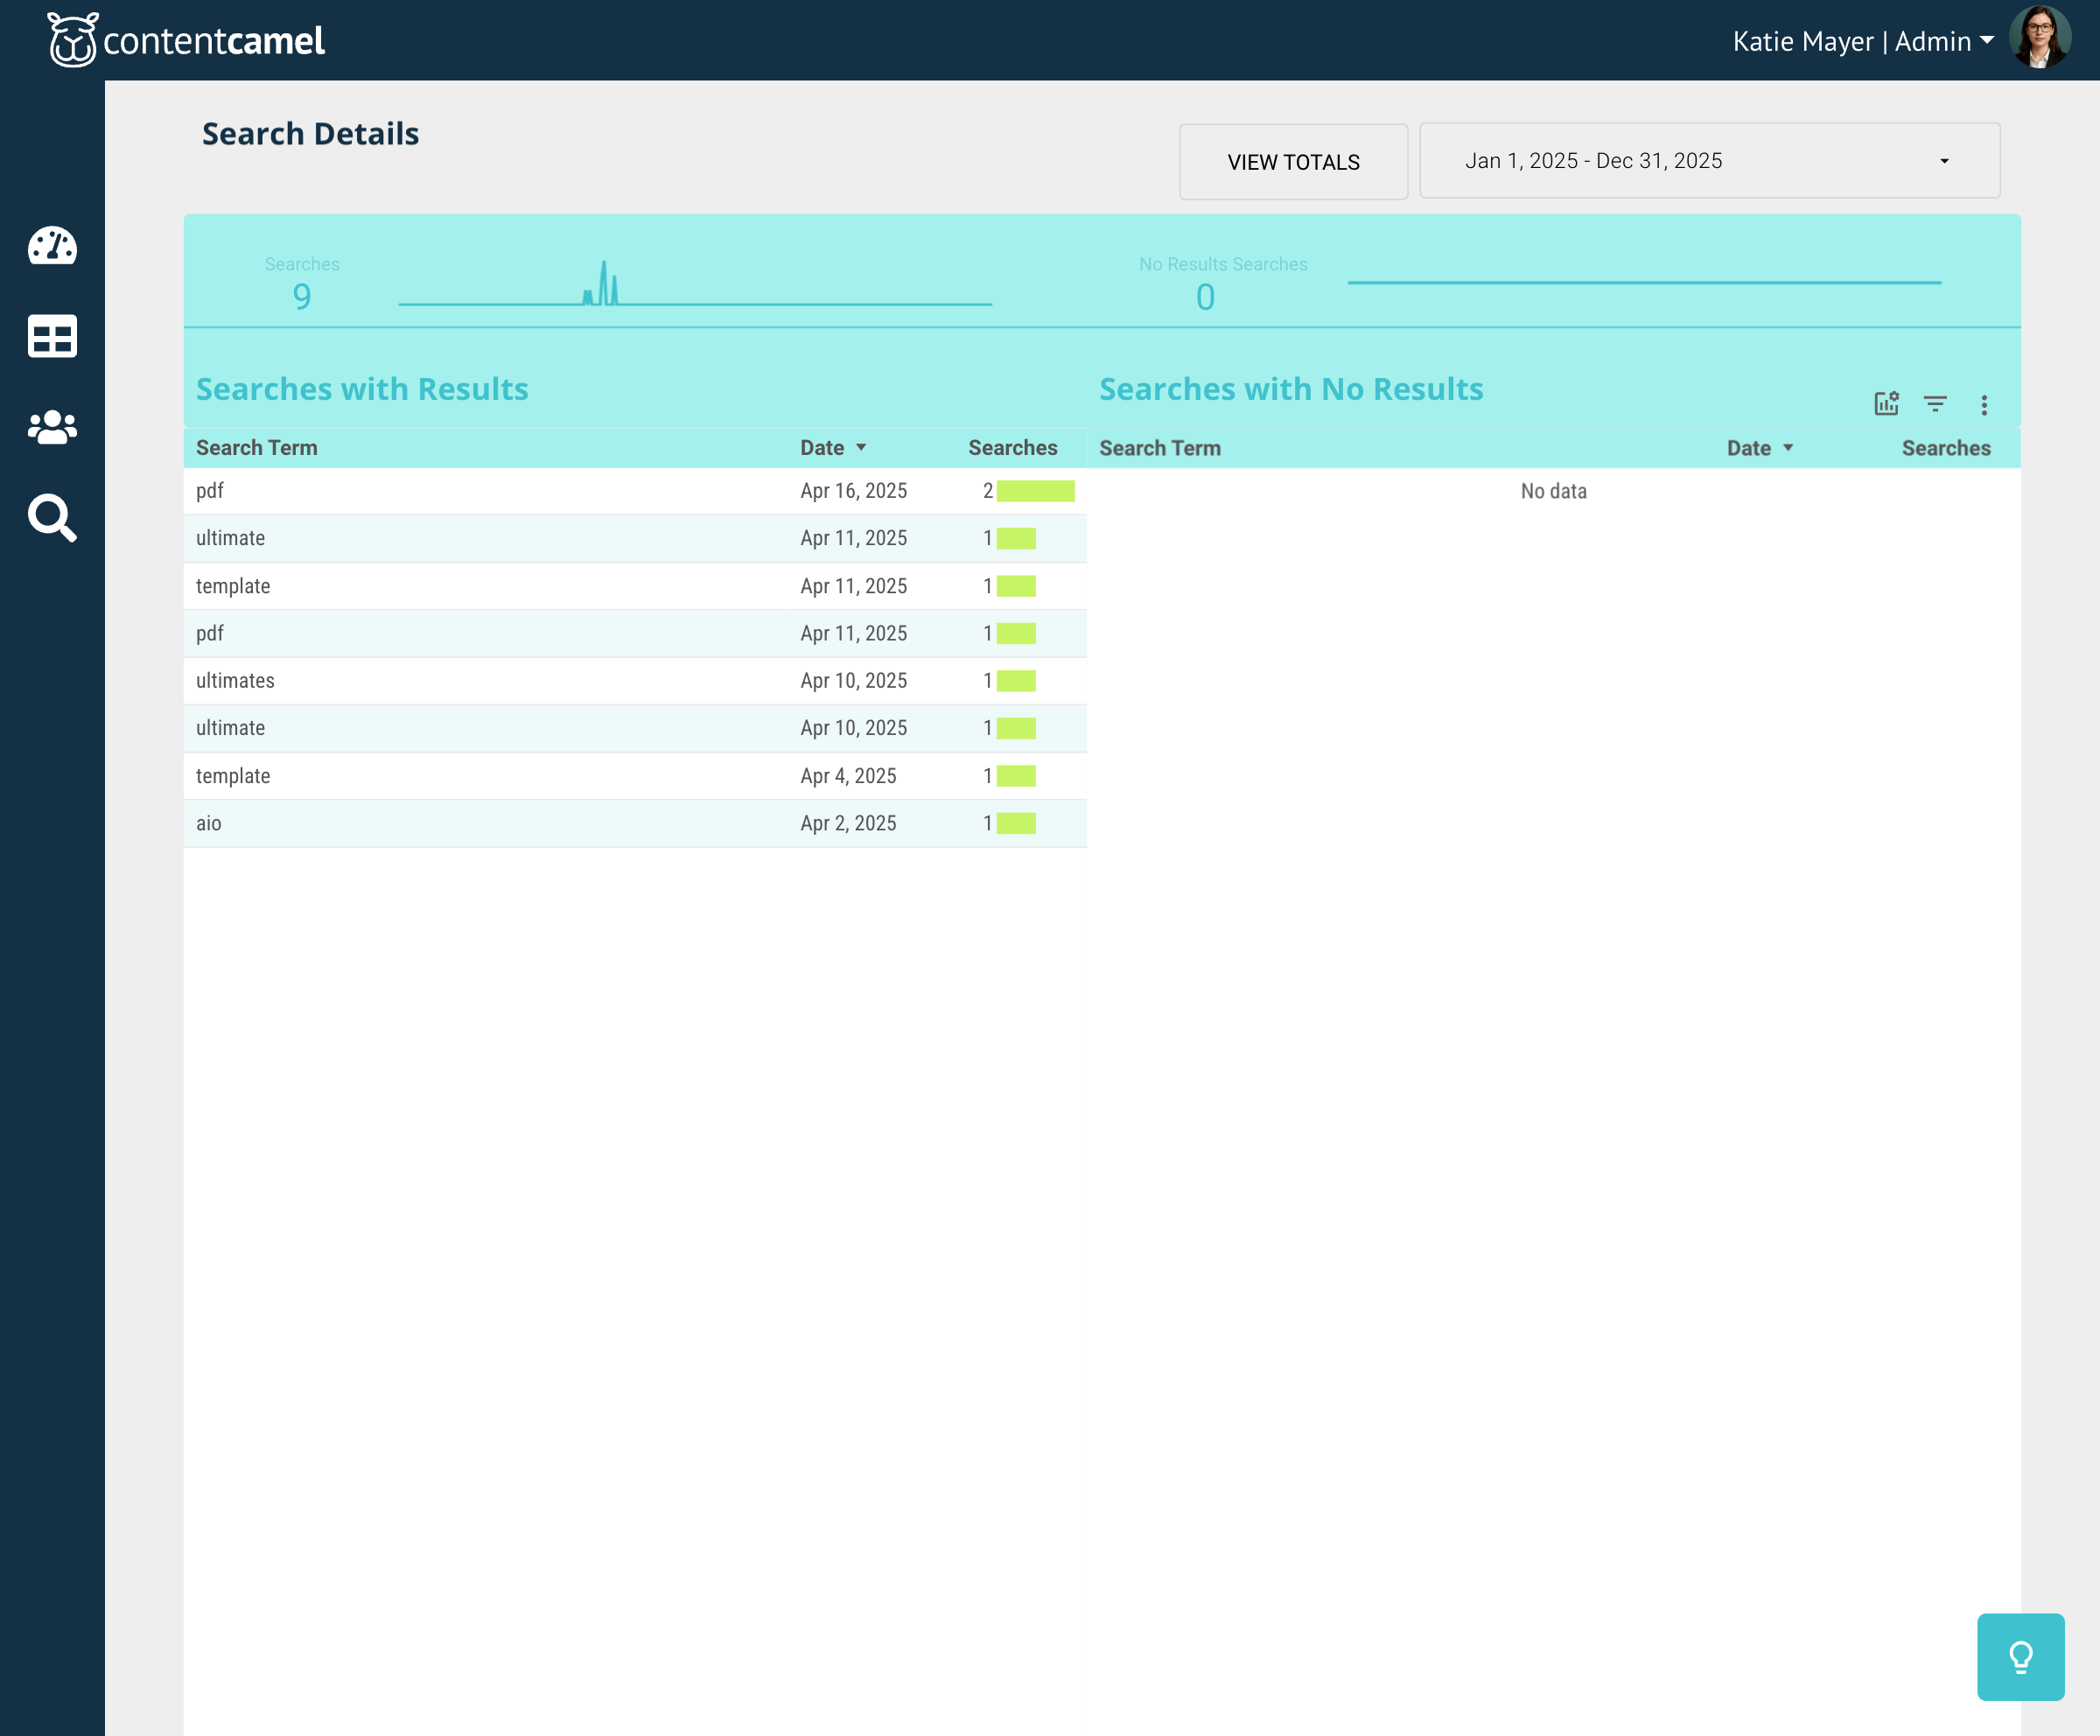
What you'll see
The Search Details page shows:
Searches - Total number of searches performed
No Results Searches - Searches that didn't return any results
Search terms - What people are actually searching for
Dates - When searches occurred
Search frequency - How often each term is used
Search categories
The page is divided into two key sections:
Searches with Results - Terms that successfully found content Searches with No Results - Terms that didn't match any assets
👉 TIP: Pay special attention to "No Results Searches." These reveal gaps in your content library or opportunities to improve your tagging and organization.
Using this data
Search analytics help you:
Improve content organization - Tag assets with the terms people actually search for
Identify content gaps - Create assets for topics with no results
Optimize findability - Make sure your most-searched content is easy to locate
Understand user needs - See what your team is looking for
Adjusting the time range
All analytics views include a date range selector that lets you adjust the reporting period.
Common time ranges include:
Last 7 days
Last 30 days
Last quarter
Last year
Custom date range
This helps you spot trends, compare periods, and focus on the most relevant data for your needs.
Best practices
Check analytics weekly - Make it part of your routine to review performance
Look for trends - Don't just focus on point-in-time metrics
Act on insights - Use the data to guide your content strategy
Share wins with the team - Celebrate successes and recognize contributors
Address gaps - When you see no-result searches or low-performing content, take action
Combine data sources - Look at asset, user, and search analytics together for the full picture
Have questions?
If you have any questions about understanding or using organization-wide analytics, reach out to our support team. We're here to help you make data-driven decisions about your content strategy.